Digital Status Reporting
Digital marketing is fluid and fast-moving. Our Ops Centers contain all the information needed to see what’s working, what needs improvement, and what we should do next.
Every client of ours gets their own Ops Center. All the links they need to go to all the resources we run for them – files and folders; projects underway; SEO information, and more. So everything they need to click to is in one place. But that’s just the appetizer.
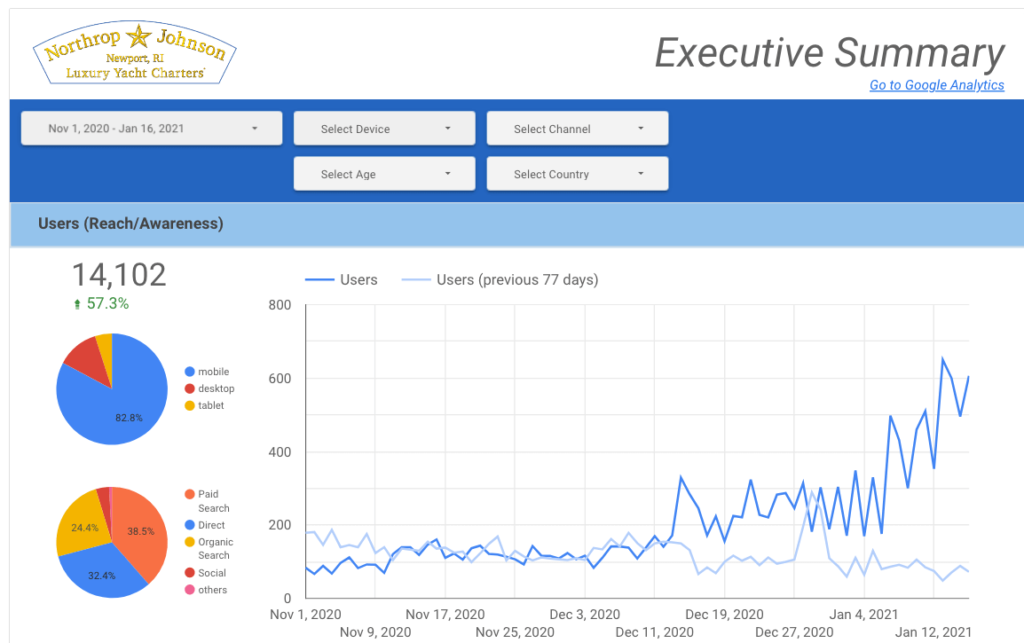
The real meal – and the tool that is literally changing how effective we can be with everything we’re doing – are dashboards that pull data from Google Analytics and a variety of other sources, and present them in a clear manner that is easy to manipulate. Want to see the overall rise in traffic? Conversions? Want to see which pages and posts are bringing in the most traffic? Want to compare this month to last month, or this year to last? Want to view the data by channel (e.g., see how much traffic and how many contact forms and how many sales you got from social, or organic, or link referrals)? Click and see.
There’s something about straightforward data that helps you make solid and profitable decisions, decisions that lead to more revenue.
Frankly, I have been dreaming of this kind of data, presented concisely and logically, for decades. Thanks to a great team, and constant refinement, we now have it – and our clients, and all of our meetings, are benefitting from it. – Kristin Zhivago


'%3e%3cg id='Final-Copy-2_2_' transform='translate(1275.000000, 200.000000)'%3e%3cpath class='st0' d='M7.4,12.8h6.8l3.1-11.6H7.4C4.2,1.2,1.6,3.8,1.6,7S4.2,12.8,7.4,12.8z'/%3e%3c/g%3e%3c/g%3e%3c/g%3e%3cg id='final---dec.11-2020'%3e%3cg id='_x30_208-our-toggle' transform='translate(-1275.000000, -200.000000)'%3e%3cg id='Final-Copy-2' transform='translate(1275.000000, 200.000000)'%3e%3cpath class='st1' d='M22.6,0H7.4c-3.9,0-7,3.1-7,7s3.1,7,7,7h15.2c3.9,0,7-3.1,7-7S26.4,0,22.6,0z M1.6,7c0-3.2,2.6-5.8,5.8-5.8 h9.9l-3.1,11.6H7.4C4.2,12.8,1.6,10.2,1.6,7z'/%3e%3cpath id='x' class='st2' d='M24.6,4c0.2,0.2,0.2,0.6,0,0.8l0,0L22.5,7l2.2,2.2c0.2,0.2,0.2,0.6,0,0.8c-0.2,0.2-0.6,0.2-0.8,0 l0,0l-2.2-2.2L19.5,10c-0.2,0.2-0.6,0.2-0.8,0c-0.2-0.2-0.2-0.6,0-0.8l0,0L20.8,7l-2.2-2.2c-0.2-0.2-0.2-0.6,0-0.8 c0.2-0.2,0.6-0.2,0.8,0l0,0l2.2,2.2L23.8,4C24,3.8,24.4,3.8,24.6,4z'/%3e%3cpath id='y' class='st3' d='M12.7,4.1c0.2,0.2,0.3,0.6,0.1,0.8l0,0L8.6,9.8C8.5,9.9,8.4,10,8.3,10c-0.2,0.1-0.5,0.1-0.7-0.1l0,0 L5.4,7.7c-0.2-0.2-0.2-0.6,0-0.8c0.2-0.2,0.6-0.2,0.8,0l0,0L8,8.6l3.8-4.5C12,3.9,12.4,3.9,12.7,4.1z'/%3e%3c/g%3e%3c/g%3e%3c/g%3e%3c/g%3e%3c/svg%3e) Your Privacy Choices
Your Privacy Choices